ISSN 1063-7850, Technical Physics Letters, 2009, Vol. 35, No. 10, pp. 938–941. © Pleiades Publishing, Ltd., 2010.
Original Russian Text © S.K. Maksimov, K.S. Maksimov, 2010, published in Pis’ma v Zhurnal Tekhnicheskoі Fiziki, 2010, Vol. 36, No. 20, pp. 21–28.
New Approach to Metrology in Nanotechnology
S. K. Maksimov* and K. S. Maksimov
Moscow Institute of Electronic Technology (Technical University), Zelenograd, Moscow, 124498 Russia
Analytics & Worldwide Technologies Company, Moscow, 127566 Russia
*e-mail: email hidden; JavaScript is required
Received May 19, 2010
Abstract—Notions of a fractional method of control in nanotechnology are presented and a key stage of the method is described that is related to determining the shape and dimensions of nanoobjects based on their scanning electron microscopy images obtained at various convergence angles of the electron probe.
DOI: 10.1134/S1063785010100196
The properties of nanoobjects are determined by the “size–structure–faceting” triad, which must be controlled both in view of their functional characteristics [1] and with respect to their compatibility with the biosphere [2]. There are no nanotechnologies capable of obtaining arrays of nanoobjects of the same size and (in view of the relationships between size, structure, and faceting) with the same set of structural[1]morphological characteristics [3–7]. Uncontrolled objects negatively influence the operation of devices and even can be dangerous, since they cause disturbances of metabolism in living organisms [1, 2]. The final checking must be based on separating fractions with different structures and morphologies, while the ecological safety makes it necessary to identify fractions that account for 10–5–10–7 of the total mass of objects [4–7]. Nanotechnologies capable of ensuring optimization of the properties of nanoobjects and being safe for the biosphere will only be possible provided that the problem of final checking will be solved [2, 4–7], but the control over shape and structure of nanoparticles can only be provided by microscopic methods. Of these, only the scanning electron microscopy (SEM)’s capable of monitoring arrays with the number of nanoobjects >=106. Under fixed conditions of formation of SEM images, their dimensions, shapes, and intensity distributions are determined by the parameters of imaged objects, so that the fractional control can be based on the distribution of images with close characteristics into groups. In order to separate fractions, it is necessary to determine reasons for the variation of these characteristics, but SEM has no methods for the characterization of objects with a priori unknown habits and composition variations [8, 9]. Thus, it is necessary to teach SEM to check for the shape and size of nanoobjects.
SEM images appear when an electron probe is scanning over the surface of an object and, thus, represent a sum of electrons generated by the object in response to the process of inelastic scattering and reflection of electrons of the probe (in its cross section with the object surface). SEM images reflect two factors: (i) the probe scanning over the object surface can go beyond its contour, and then the distribution of electrons emitted from the object superposes with the distribution of electrons emitted from the substrate. The yield of electrons emitted from the object increases when the probe passes through intersecting surfaces. For this reason, SEM images reflect the object with distortions; on these images, it is impossible to specify points that correspond to edges of an object and, hence, to directly determine its dimensions [8, 9].
The size of a focused SEM probe now approaches ~1.0 nm, but even these SEM instruments cannot solve the problem of characterizing nanoobjects because we can only determine the dimensions of and image corresponding to a projection of the object, whereas neither its height nor the heights of details are determined, and its shape and crystallographic habit remain unknown. The problem of determining the habits of nanoobjects also cannot be solved using stereo imaging techniques, since changes in the images caused by the aforementioned factors and those related to variations of projections are comparable [8. 9]. SEM employs probes with convergence angles χ≈10–3 rad, which implies that the depth of focus (DOF) is ≥0.5 µm [8]. Thus, the DOF is greater than the object height, and the size of the probe moving over the object surface remains virtually unchanged. However, for .. 10–1 rad, the DOF drops to .10 nm, so that it becomes smaller than the object height. Then, the probe size varies during motion over the surface of an object even with a height of about 10 nm, that is, the probe exhibits defocusing. This defocusing (in contrast to the “instrumental” defocusing that is caused by an inadequate excitation of the object) may be called “habital.” Below, the situation in which the DOF is greater than the object height is called sufficient depth of focus (SDOF), while the case where the DOF is smaller than the object height is called insufficient depth of focus (IDOF).
The action of an object with the probe, whose size varies during the motion over the object surface, can be characterized by the “action surface” and, in a certain section, by the “action curve.” In this study, the effect of habital defocusing is treated based on the notion of the action curve, but all laws remain also valid for the action surface, that is, in application to 3D intensity distributions. The action curve I. is described by the following expression [10]:
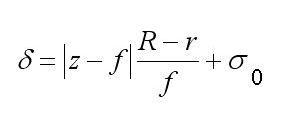
where δ = √2σ is the probe half-radius, which can be written in a linear approximation as
σ is the mean square deviation, xcis the coordinate of the probe center, J is the total probe intensity, z is the distance from an output plane of the objective lens to a point on the object surface, fis the focal distance, σ0 is the radius of the probe cross section by the focal plane, R is the radius of the output aperture of the objective lens, |z– f| is the object height, and Xis the integration domain determined by the object length in the given direction. Due to the dependence of . on |z– f|, the action curve reflects the object shape. Since δ = 2 √2σ , all routines developed for the modeling of SEM images (Joy’s PC Mote Carlo Programs, Casino Mote Carlo Program, SEMLP, etc.) are applicable to operations with the action curve.
Information about the action curve can extracted from SEM images obtained under IDOF conditions. A difference I_ between the action curves corresponding to different angles of probe convergence is expressed as follows:
where δ1 and δ2 refer to the first and second values of the probe convergence angle, respectively. Let us introduce the notion of the zero object height plane (ZOHP), that is, the plane relative to which the object height is measured. Evidently, if the object images corresponding to different angles of probe convergence in some section . are formed so that δ1 = δ2, then we have for this section I_ = 0. It should be emphasized that the action curve characterizes the integral probe action upon the object. The intensity distributions on SEM images are characterized by the intensity profiles. At points, where the local actions of probes corresponding to different angles of convergence are identical, the yields of electrons emitted from the object are also identical. These points may be called isofocus points. When the action curves are superimposed, they intersect at the points whose distance from ZOHP are equal to the distance from this planer to section Ψ for which δ1 = δ2. For the difference of action curves corresponding to different convergence angles, the difference curve will change sign or exhibit extrema at the isofocus points. For SEM images, there are rules that are most exactly satisfied for emitted electrons with energies within ~20–50 eV [8]: (i) the intensity profiles on the images corresponding to different angles of probe convergence intersect near isofocus points and (ii) on the difference of intensity profiles of the images corresponding to different angles of probe convergence, the extrema and zeros of the differential curare observed in the vicinity of isofocus points.
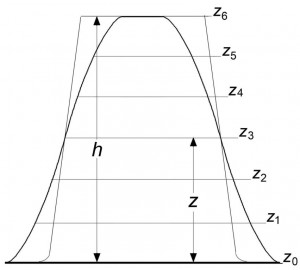
For a focused image obtained under the SDOF conditions, any section of the object is also found under conditions of exact focusing and any point on the image profile can be considered as isofocus point. Therefore, on the superposition of profiles, one of which is formed under SDOF conditions and the other, under IDOF conditions, the points of intersection of the two profiles belong to a section formed by the plane of focusing for the image obtained under IDOF conditions. This can be used for measurements along the z axis. In order to obtain 3D images from 2D patterns, it is necessary (i) to match the plane of focusing with ZOHP under IDOF conditions, (ii) to obtain a series of images by moving the plane of focusing away from ZOHP by fixed distances, and (iii) superimpose the image obtained under SDOF conditions onto those formed under IDOF conditions. As a result, the heights of the object, its details, and the numerical values of x, y, and zcoordinates of individual points will be determined.
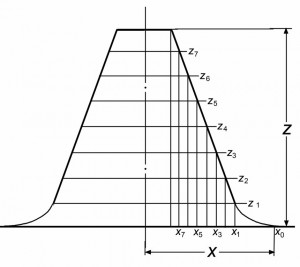
Figures 1 and 2 illustrate the procedure of determination of the object shape. By virtue of the laws of focused SDOF images [8, 9], the characteristics of a 3D SDOF image most exactly reflect the shape and dimensions of the object. This image can be used as an initial model for reconstructing the true parameters of an object.
Fig. 1. Schematic diagram illustrating the superposition of intensity profiles obtained under (thick curves) IDOF and (thin curves) SDOF conditions: (zi) virtual planes of focusing; (a0) ZOHP; (z6) upper face plane; (z3) plane of focusing; (Z) distance from place of focusing to ZOHP; (h) object height, both profiles, and plane of focusing intersect at one point that occurs at distance Z from ZOHP.
Fig. 2. Schematic diagram illustrating the formation of a model object by means of processing of the intensity profile obtained under SDOF conditions. The slope of the side branches is increased as compared to that in Fig. 1, in order to more clearly reveal features of the determination of x coordinates: (zj–z) coordinates of points for which the distance from ZOHP is determined along the z axis; (xj –x) coordinates of the projections of points for which the distance from ZOHP is determined along the z axis and the distance from the object axis is determined along the x axis; (Z) distance from the ZOHP to the upper face; (X) distance from the object image edge to its axis.
The following sequence of stages is proposed for determining true parameters of an object using its 3D model image:
(i) Construct a SEM image of a model with a composition, corresponding to that of the object, under conditions identical to those used for the formation of the object image [8].
(ii) Fit the model image to the experimental image by varying the object dimensions.
(iii) Accept the dimensions for which the model image coincides with the true image, as the object dimensions.
The final stage of the proposed approach to object identification is identical to approaches, in which the object dimensions are determined by fitting images of a measure or a putative reference object to an experimental image [11]. However, the proposed approach is not based on assumptions concerning the object habit, but rather on a reconstructed 3D image that objectively reflects the habit. This approach is applicable to objects of any, even most complicated shapes, and it eliminates errors caused by the mismatch between shapes of a measure or a putative reference object and real objects [8, 9]. In combination with the method of electron backscatter diffraction [12], the proposed approach makes it possible to control the structure and morphology of objects using images of each group.
The control of arrays (after establishing relations between the characteristics of objects and their images) reduces to recognizing images of various types on SEM micrographs. The rate of this control approaches that of the interstage control in microelectronics. Thus, it will meet the requirements of both final checking and interstage control. Presently, most technical problems encountered is implementation of the proposed approach are soled, in particular, spherical aberration controllers [13], devices controlling the probe convergence angle [14], and systems for the comparison of images corresponding to different probe convergence angles [13] have been developed. For implementation of the proposed method, it is only necessary to equip a scanning electron microscope with a mechanism controlling the matching of a focusing plane with ZOHP and its subsequent shifts to preset positions. Attaching a device of the type used in scanning probe microscopy [15], where a point on a cantilever serves as a probe and a reflected laser beam is used in the detection system, is a technically solvable task.
REFERENCES
- M. S. Dresselhaus, Yu.-M. Lin, O. Rabin, et al., Nanowires, in Springer Handbook of Nanotechnology, Ed. by B. Bharat (Springer, 2007), pp. 113–160.
- C. M. Sayes and D. B. Warheit, Intern, J. Nanotechnol. 5, 15 (2008).
- M. G. Bawendi and K. F. Jensen, Inventory Control, US Patent no. 6 774–361 (2004).
- Nanotechnology: Consequences for Human Health and Environment, Ed. by R. E. Hester and R. M. Harrison, (RSC Publishing, 2007), p. 149.
- S. K. Maksimov and K. S. Maksimov, Ross. Nanotekhnol 4 (3–4), 59 (2009) [Nanotech. Russ. 4, 188]
- S. K. Maksimov and K. S. Maksimov, Nanotekhnika 18, 5 (00912.
- 7. S. K. Maksimov and K. S. Maksimov, Pis’ma Zh. Tekh. Fiz. 35 (5), 58 (2009) [Tech. Phys. Lett. 35, 224 (2009)].
- J. Goldstein, D. Newbury, D. Joy, et al., Scanning Electron Microscopy and X-Ray Microanalysis (Kluwer & Plenum, New York, 2003).
- J. Liu, High Resolution Scanning Electron Microscopy, in Handbook of Microscopy for Nanotecnology, Ed. by. N. Yao and Zh. L. Wang (Kluwer Academic Publ., 2005), pp. 325–360.
Translated by P. Pozdeev


 English